How We Took a Client Site From a Failing Google PageSpeed Score to 100/100
By Luke Zgaga · · 9 min read
Google PageSpeed Insights is one of the few tools that tells you, in a single screen, how Google experiences your website. Most sites score badly and most owners never find out why. This is the story of one we fixed in a single day — a client site that went from a failing performance score, a 4.4-second first paint and a Largest Contentful Paint that Google could not even measure, to a clean 100/100 across Performance, Accessibility, Best Practices and SEO. Here is exactly what we changed, and why each fix matters for both search rankings and paid media.
What does Google PageSpeed Insights actually measure?
PageSpeed Insights runs Google's Lighthouse audit against your page on a throttled mobile connection and reports four scores: Performance, Accessibility, Best Practices and SEO. The Performance score is the one everyone chases, and it is calculated from the Core Web Vitals and their supporting metrics: First Contentful Paint (FCP), Largest Contentful Paint (LCP), Total Blocking Time (TBT), Cumulative Layout Shift (CLS) and Speed Index. Core Web Vitals are a confirmed Google ranking signal, so page speed optimisation is technical SEO — not a vanity exercise.
The starting point: a site Google couldn't score
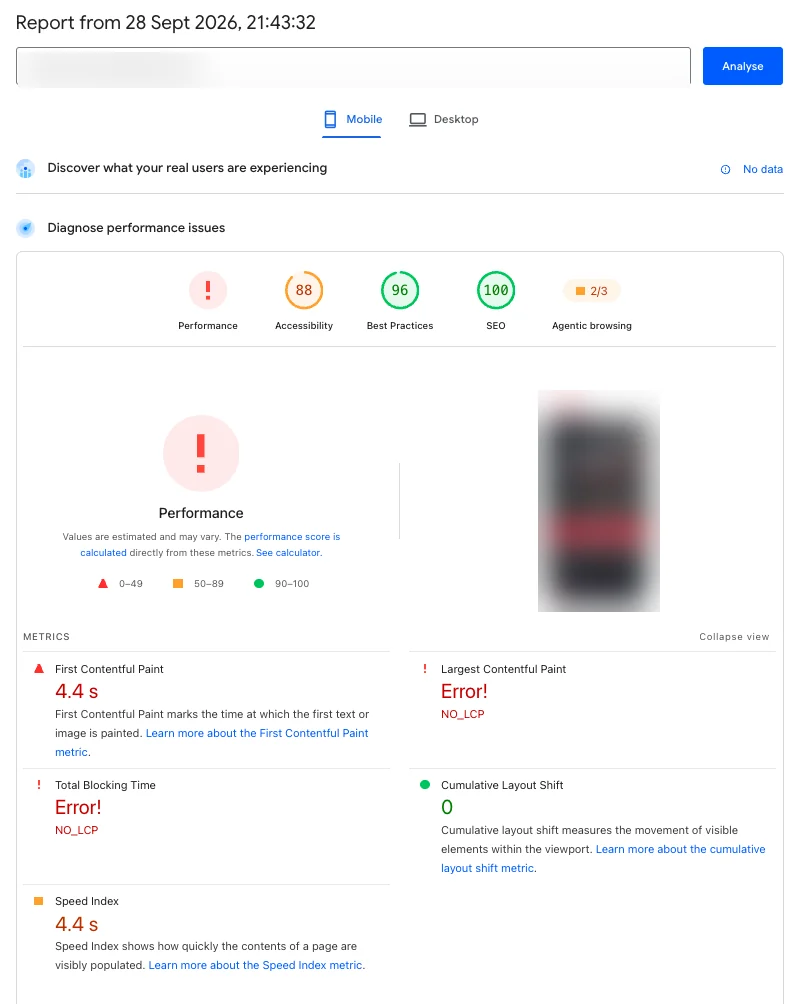
The "before" report tells the whole story. First Contentful Paint at 4.4 seconds on mobile (Google wants under 1.8s). Speed Index also 4.4s. And the two metrics that matter most — Largest Contentful Paint and Total Blocking Time — showing NO_LCP errors, meaning Lighthouse never saw a "largest" element paint. Because the Performance score is a weighted blend of those five metrics, with two of them missing Google simply refused to produce a number. Accessibility sat at 88, Best Practices at 96.
Fix 1: stop throwing away the server-rendered page
The site was built as a modern React application with server-side rendering, which should make it fast — the HTML arrives fully formed. But the client-side code was mounting with createRoot().render(), which discards the server-rendered DOM and rebuilds the entire page from scratch in the browser. Every visitor was paying to render the page twice. Switching to hydrateRoot(), which reuses the existing markup, was the single biggest win: First Contentful Paint dropped from 4.4s to 1.2s. If your framework supports hydration and you are not using it, this is the first thing to check.
Fix 2: make the hero image earn its place
The hero background was a 210KB JPEG. We converted it to WebP (138KB for desktop, 53KB for mobile), served the right size to the right screen with a responsive srcset, gave it explicit width and height attributes so the browser reserves space (zero layout shift), and told the browser it was the most important asset on the page with fetchpriority="high" and a <link rel="preload">. Image optimisation is the cheapest, most reliable page speed lever there is — and WebP alone typically cuts image weight by 30–60%.
Fix 3: remove render-blocking third-party resources
The page loaded an entire icon font library from a public CDN as a render-blocking stylesheet in the <head> — the browser could not paint anything until it arrived, and the CDN was occasionally rate-limiting requests, logging console errors that also dented the Best Practices score. The site only used nine of those icons. We subset the font to just those glyphs (2.2KB instead of hundreds), self-hosted it, inlined the CSS, and loaded the font with font-display: swap. One dependency, four separate audit flags cleared: render-blocking requests, font display, third-party usage and console errors.
Fix 4: browser caching and security headers
Lighthouse flagged 115KB of assets served without efficient cache lifetimes. Because the build fingerprints its JavaScript and CSS, we set them — along with images and fonts — to cache for a year as immutable, while keeping HTML on always-revalidate so deployments show instantly. In the same pass we added the trust and safety headers Lighthouse looks for: HSTS, X-Content-Type-Options, X-Frame-Options, Referrer-Policy and Cross-Origin-Opener-Policy. Repeat visitors now load the site almost entirely from cache.
Fix 5: the hidden LCP killer
After those changes the first paint was fast, but Lighthouse still reported no Largest Contentful Paint — on mobile and desktop. This took real diagnosis: other pages on the same site measured LCP perfectly, so it was homepage-specific. The culprit was a card carousel built with CSS scroll-snap-type: mandatory and scroll-behavior: smooth. A mandatory snap container can perform a compositor scroll at initial layout, and Chrome stops tracking LCP the moment it sees a scroll. Removing the CSS snapping (the carousel's JavaScript navigation still works) restored the metric: LCP 1.7s, TBT 40ms, and the Performance score finally appeared — at 100. The lesson: a missing LCP is not "no data", it is a bug, and it silently removes your site from a Core Web Vitals ranking signal.
Fix 6: layout stability and smooth animation
Every image without explicit dimensions is a potential layout shift, so we added width and height to all of them, including the logo and content images. The site's animated marquee was pinned to the GPU with will-change: transform so it never fights the main thread, and a chart animation that briefly produced invalid values on its first frame — the source of the remaining console errors — was corrected. CLS held at a perfect 0 throughout.
Fix 7: accessibility to 100
Accessibility is scored too, and it is often the fastest category to fix. Icon-only links gained aria-labels so screen readers can name them. Tiny 8px carousel dots became proper 24px tap targets, and footer links were padded for touch. The brand's pink accent was only 3.9:1 against white — below the WCAG AA 4.5:1 threshold for small text — so we kept the exact brand colour on headings (large text passes at 3:1) and nudged small text and button backgrounds to near-identical, compliant shades. Nobody notices the difference; the audit does.
The result
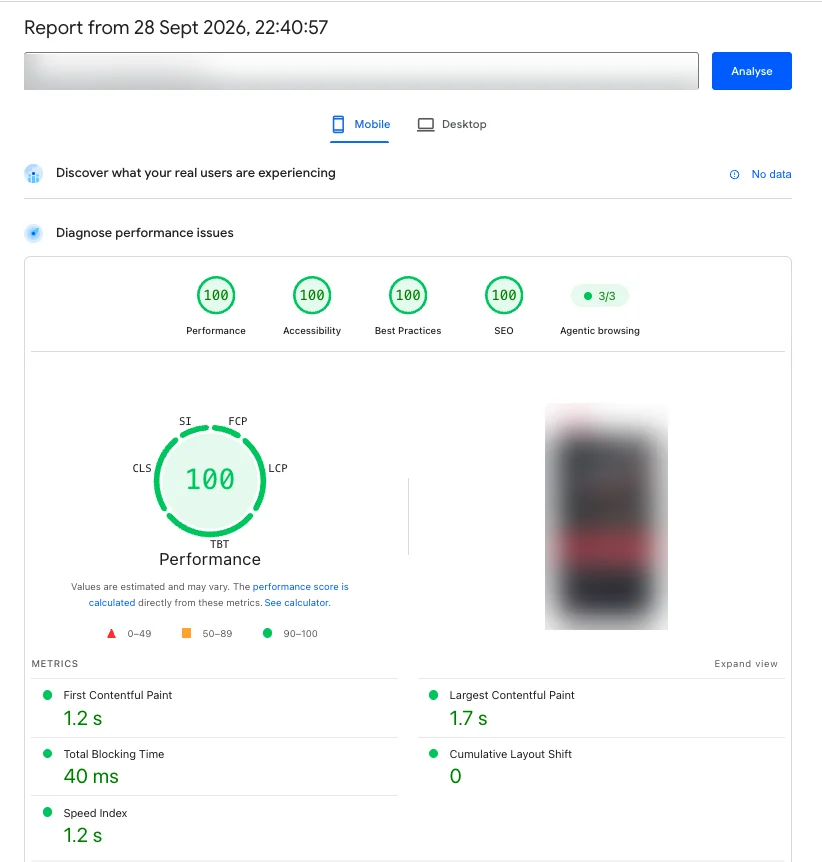
Same site, same content, same day. Performance, Accessibility, Best Practices and SEO all at 100, with every Core Web Vital comfortably inside Google's "good" thresholds.
Why page speed matters beyond the score
Fast pages rank better, but the commercial impact runs deeper than SEO. For paid media, the landing page experience feeds Google Ads Quality Score, which directly lowers cost per click. And conversion rate is brutally sensitive to load time — Google's own research shows the probability of a bounce climbing sharply with every extra second on mobile. A faster site makes every channel you run cheaper and more effective, which is why we treat site speed as part of conversion rate optimisation, not a separate technical chore. It compounds with the work in our CRO best-practices guide.
A page speed checklist you can run today
- Run PageSpeed Insights on mobile and note which metrics are red or missing.
- Convert images to WebP, size them responsively, and add width and height.
- Preload and prioritise the hero image; lazy-load everything below the fold.
- Find render-blocking CSS and JavaScript and defer, inline or remove it.
- Self-host fonts and icons; avoid whole libraries for a handful of glyphs.
- Set long, immutable cache headers on fingerprinted assets.
- If your framework server-renders, make sure the client hydrates rather than re-renders.
- If LCP is missing, hunt for carousels, snap-scrolling or fade-in animations.
- Fix contrast, accessible names and tap targets — Accessibility is scored too.
Common questions about Google PageSpeed optimisation
Does a PageSpeed score affect Google rankings? The score itself is not a ranking factor, but the Core Web Vitals it is built from are. Real-user field data carries more weight than the lab score, so fixing what the lab report shows is how you improve the field data.
What is a good PageSpeed score? 90 and above is "good" (green). For Core Web Vitals, Google's thresholds are LCP under 2.5s, INP under 200ms and CLS under 0.1.
Why does my report show no Largest Contentful Paint? It is almost always a page behaviour — content replaced after load, hidden by a fade-in, or a scroll triggered during load — rather than missing data. It should be treated as a bug and fixed.
Technical SEO like this sits alongside the content and authority work in our SEO & content service and the wider organic and AI search discipline — because a site that loads in a second is easier for Google, for AI answer engines and for the humans you are paying to send there. If your PageSpeed report looks like the "before" above, that is exactly the kind of problem we like fixing.